

When Alison Pearlman was starting to work on her book, May We Suggest: Restaurant Menus and the Art of Persuasion (as she notes in its introduction), she reached out to Sarintip “Jazz” Singsanong, co-owner of Jitlada, one of the most celebrated Thai restaurants in LA. She had a few questions about the design of the restaurant’s menu, and so Jazz immediately walked her over to meet her brother (also co-owner and chef), Suthiporn “Tui” Sungkamee.
The irony here is that when Pearlman said “menu,” she actually meant the object – the physical document- and she wanted to know about its particular layout and design choices. Jazz and Tui heard “menu” and understood “food,” and so they talked at length about their dishes and how proud they were of them.
And there lies the issue… there’s so little talked about on the menu itself, like what items to include? How to price it? Where to position a particular item? What color should the menu be? What should be the font style? How big should the font be? And so on and so forth.
That’s exactly what this article is about – Restaurant menu engineering – because those seemingly small decisions influence what customers order, how much they spend, and ultimately, how profitable your restaurant will be.
What You’ll Learn
- What is menu engineering & how does it increase restaurant profits?
- How to apply menu psychology, pricing, and layout strategies to influence customer choices, increase average spend, and maximize restaurant profits.
What Is Menu Engineering?
Menu engineering is the practice of analyzing and “strategically” designing a restaurant’s menu so as to maximize profits. There are many ways to do it. For example, you could highlight the profitable items on the first page or use colors or design elements that pop.
Basically, when we ask you to engineer your menu, we’re asking you to pair your food cost, contribution margin, sales data, etc., with menu psychology so that every item on the menu earns its place.
And the first step is to categorize menu items by popularity (sales volume) and profitability, so restaurants can identify which items contribute more to profit margin and which may need to be updated or removed entirely. And most importantly, this isn’t something you do once and pack up. You need to treat your restaurant menu as a living document, and revisit it every few months as food costs increase/decrease, customer preferences change, and new dishes are added or removed. This applies whether you hand out physical menus or an online menu for delivery.
Restaurants that use a menu engineering process (again, the keyword “strategically”) can see profits increase by 10-15 percent, and some report a 10-20% increase after consistently implementing effective menu strategies over time.
The 4 Menu Item Categories: Stars, Plowhorses, Puzzles, and Dogs
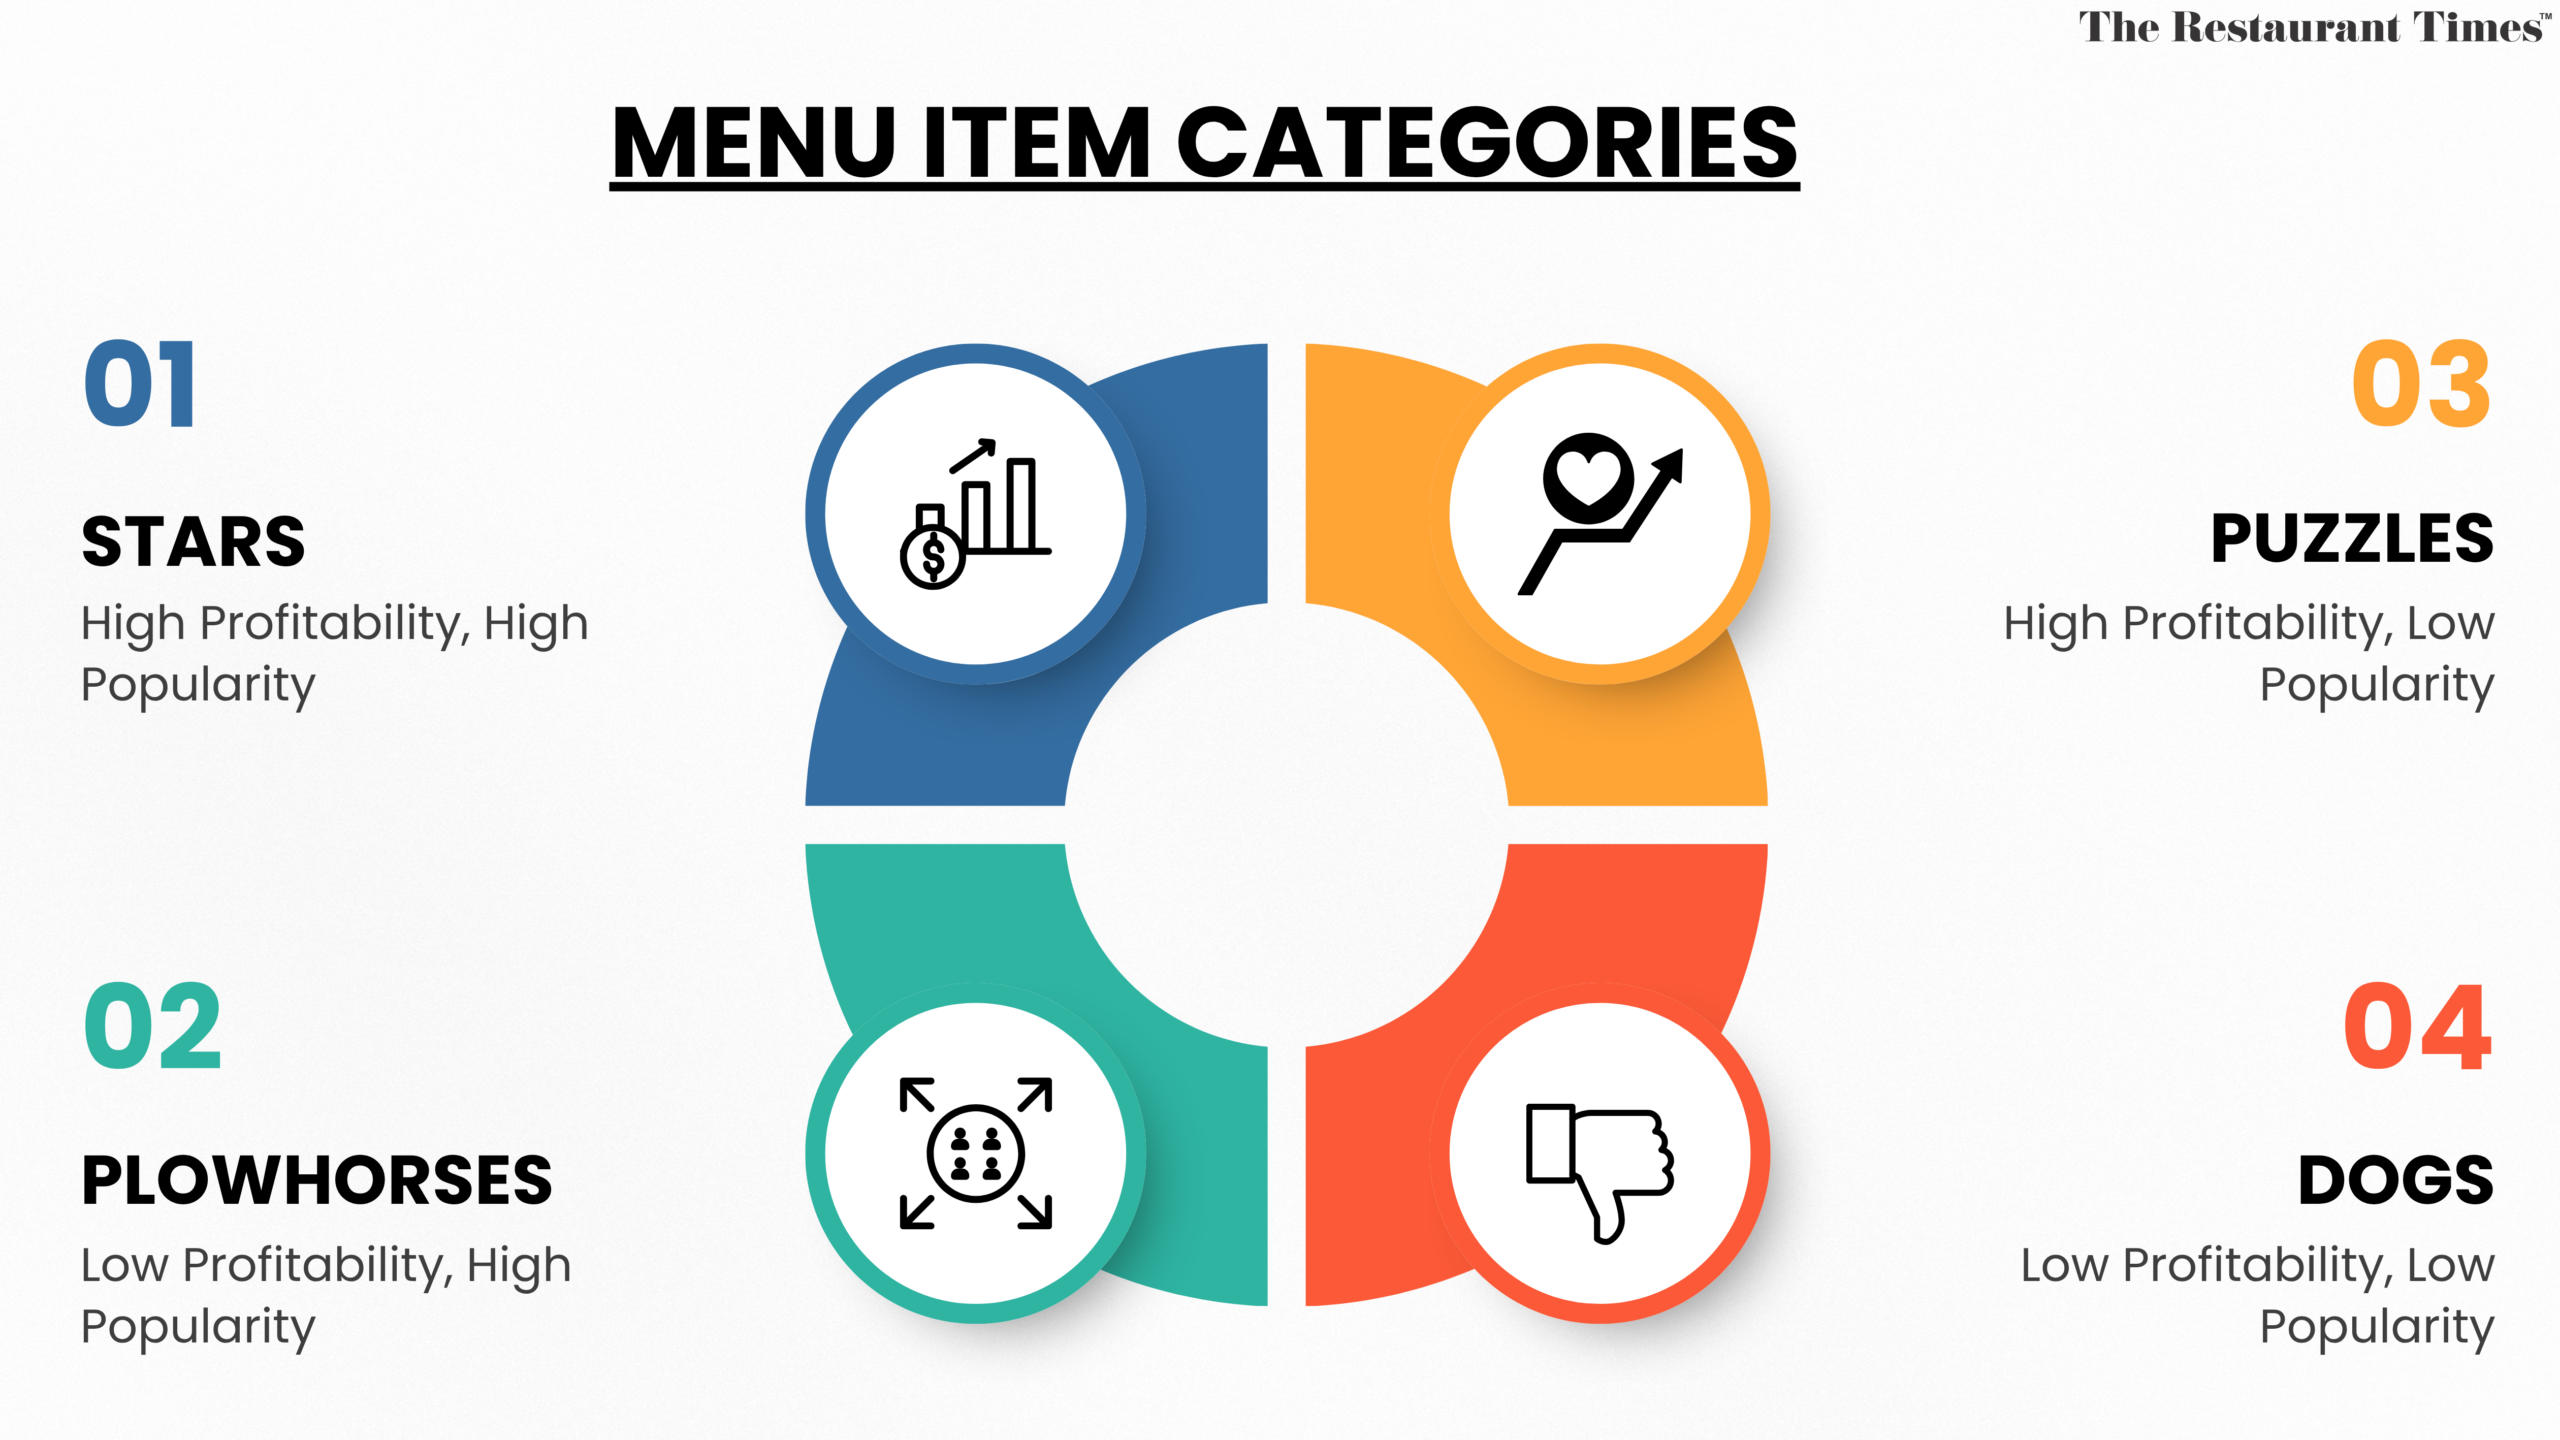
Based on the popularity and profitability of menu items, they can be categorized into four groups: Stars, Plowhorses, Puzzles, and Dogs, which helps in making informed decisions about menu adjustments. And, in fact, they are the backbone of the entire menu engineering process because each of the four categories requires a very different strategy. Let’s discuss each one by one!
#1: Stars (High Profitability, High Popularity)
Say you sell a burger that costs you very little to produce, but they are customer’s favorite and brings you the most profit, no matter what – that’s your star – One of the most popular and profitable items.
For such menu items:
- Keep the recipe consistent.
- Keep the quality super high.
- Give it prime visibility on the menu.
You could maybe test a small price increase on stars, since demand for them tends to hold steady.
#2: Plowhorses (Low Profitability, High Popularity)
Now, relative to stars, plowhorses are popular menu items, but the cost of preparing them is a bit on the more expensive side. Meaning they sell a lot but don’t contribute much to your bottom line.
Optimizing such menu items means you’ll have to identify those popular but low-profit margin foods and then strategize to enhance profitability.
A few ways to do this:
- Raise their price gradually in small increments.
- Swap in a slightly less expensive ingredient.
- Reduce the portion size by just a little.
- Pair the item with a high-margin add-on.
The goal here is to improve the item’s contribution margin while making sure its popularity stays as it is (or even improves, if possible).
#3: Puzzles (High Profitability, Low Popularity)
Puzzles are menu items that are profitable, but not a very popular choice, really. They cost little to produce, so the food cost is set, but of course, you’d want to get more people to actually order the dish. Now, more often than not, a dish is unpopular because it is either not visible enough, its wording is ambiguous (like, what is it really? What are the ingredients?), or it is pricey.
So, what should you do?
- Move the item into a more prominent spot on the menu.
- Rewrite the description with richer, more descriptive language.
- Add a photo if your format allows it.
- Train staff to recommend it directly.
And, if possible, you can try reducing the price just a little.
#4: Dogs (Low Profitability, Low Popularity)
Dogs are the items that cost too much to make, and customers barely order them anyway. They are just on the menu for the sake of it – they are just taking space and adding complexity to your kitchen’s prep list for very little to no return.
You may want to cut such dishes entirely, but before that, ask yourself whether those dishes are a house specialty, or maybe it’s a kids’ menu staple, or something that uses up ingredients that would otherwise go to waste. If none of that applies, it’s usually best to remove or reformulate it altogether.
INDUSTRY INSIGHT
| Before we move forward, here are some formulas you would want to know so you can better calculate and categorize menu items under the above 4 categories: Contribution Margin: It’s the difference between an item’s selling price and its cost of making. It’s one of the key metrics that determines the profitability of each dish on a restaurant’s menu. You can calculate it using – Contribution margin = Menu price – Food cost Next is the food cost percentage, Food cost percentage = (Food cost ÷ Menu price) × 100 As per industry benchmarks, food cost percentage in full-service restaurants is between 28-35%, though a dish with a slightly higher percentage can still be one of your most profitable menu items if its contribution margin is strong as well. To figure out your menu item’s popularity, look at its share of total sales over a set period, then compare that against an expected benchmark. A common rule of thumb is that an item is considered popular if it hits at least 70% of its expected fair share. For example, if you have 20 items on your menu, an even split would put each item at 5% of total sales. Multiply that by 70%, and you get a popularity threshold of 3.5%. Anything selling above that line is popular; anything below it is not. |
Restaurant Menu Engineering Process: A Step-by-Step Guide
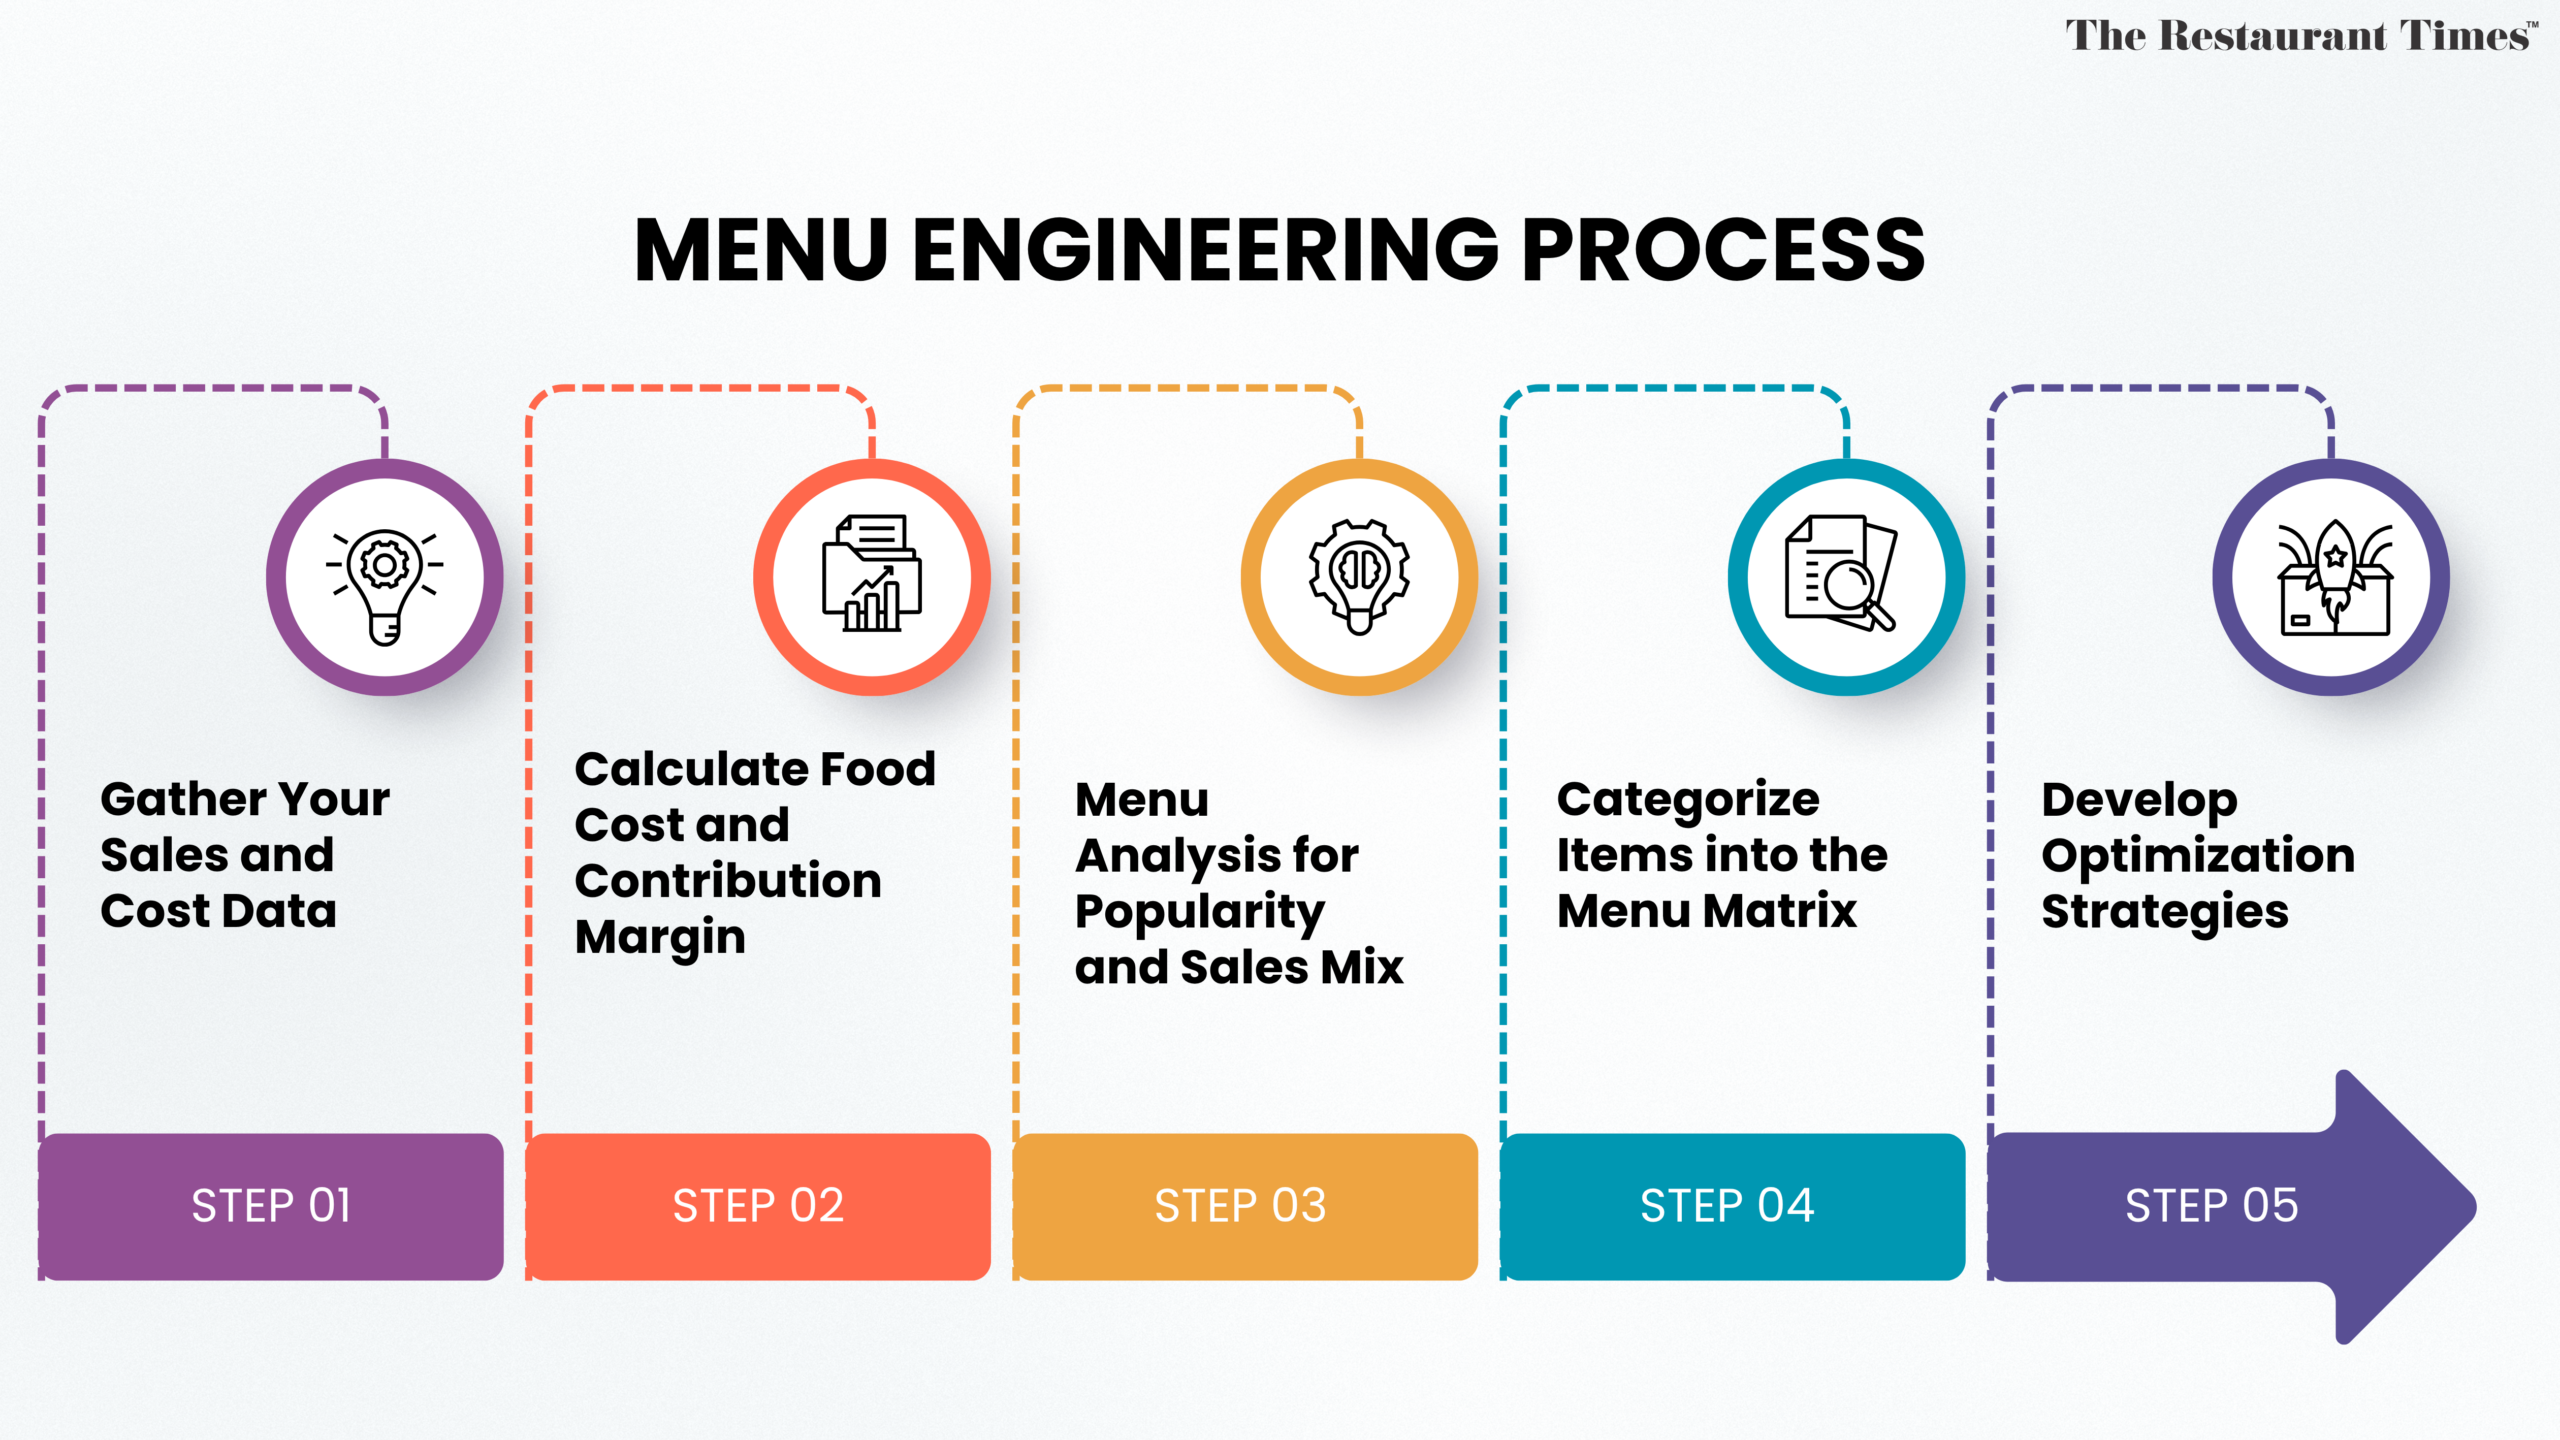
There are five key steps to engineer your menu:
Step 1: Gather Your Sales and Cost Data
First, if your menu doesn’t change too often, pull sales data from your POS system for 30 to 90 days, or longer. Alongside that, gather your recipe costing and current menu prices for every dish. If your restaurant runs a seasonal menu, tie the analysis window to that season instead.
Step 2: Calculate Food Cost Percentage and Contribution Margin
Next, for each item, calculate the total cost of ingredients (down to the garnish and cooking oil), then subtract it from the selling price to get the contribution margin.
Step 3: Menu Analysis for Popularity and Sales Mix
At this step, calculate the menu mix percentage for every item by dividing its total sales by the total number of menu items sold. It shows which dishes customers order most often, so you can better categorize them as “favorite” or “underperformer.”
Step 4: Categorize Menu Items into the Menu Matrix
Once you have both figures for every dish, plot them onto the menu matrix.
The menu engineering matrix, or simply a menu matrix, is a four-quadrant chart that classifies menu items based on two variables:
- Profitability (Contribution Margin): How much profit the dish generates after food costs.
- Popularity (Menu Mix): How frequently customers order the dish.
To create the menu matrix, draw a graph with:
- X-axis: Popularity (Low → High)
- Y-axis: Profitability (Low → High)
Then, plot menu items using the profitability and popularity figures you calculated in the previous steps. The average contribution margin and average menu mix percentage will be the dividing lines that will create four distinct quadrants: stars, plowhorses, puzzles, and dogs.
Step 5: Develop Optimization Strategies
Finally, think about what you want to do with items in each category.
For stars, keep recipes and portions consistent, give these items prime placement on the menu, and encourage servers to recommend them.
For plow horses, test small price increases, adjust portion sizes, or bundle them with high-margin sides and drinks.
Move puzzles to high-attention areas of the menu, rewrite descriptions, add high-quality photos where appropriate, and feature them in limited-time promotions.
For dogs, determine whether they strengthen your brand, satisfy a niche audience, or support other sales; if not, remove them from the menu.
Menu Engineering Tricks/Strategies to Increase Profitability
Pricing Strategies for Each Category of Items on the Menu
When you’re planning the pricing for each category of your menu, remember:
- Since stars have already proven their value (good value, to be exact) to customers, you can test a modest price increase (around 2-5%) during menu updates, but yes, make sure you monitor sales volume very closely afterward to catch any changes in demand.
- For plowhorses, raising prices too aggressively will backfire on you. So you should instead go for very small increases and employ strategies to lower food costs.
- As for puzzles, they sometimes sell better at a slightly lower price if that’s what’s holding back demand.
- And for dogs, frankly, they usually aren’t worth adjusting prices for at all; they’re better off removed.
Apart from these, you can use psychological pricing techniques to reduce the “pain of paying” for diners, such as removing dollar signs from pricing, which is why so many restaurants list “24” instead of “$24.00.”
Menu Design and Menu Psychology in Layout
Menu psychology focuses on how patrons interact with menus and how menus can be designed to motivate customers to take specific actions, such as ordering more and spending more.
A huge part of this comes down to eye movement; i.e., where you place menu items can significantly influence customer choices; for example, items placed in the “golden triangle,” the middle of the page, then the top right, then the top left, are more likely to be ordered.
Similarly, using color psychology can guide customers’ emotions and influence their spending habits. Warm tones like red are often used to stimulate appetite and urgency, while cooler tones tend to have the opposite effect.
Plus, try to limit menu options to 6-8 items per section to avoid overwhelming customers and assist decision-making. This ties directly into the psychological concept known as “the paradox of choice,” which suggests that when faced with too many options, customers may struggle to make decisions, leading to dissatisfaction.
Descriptive Language That Drives Sales
Descriptive copywriting enhances dish appeal and can influence customer choices far more than most restaurant owners give it credit for. For example, compare “grilled chicken with vegetables” to “herb-marinated chicken breast, flame-grilled and served with seasonal roasted vegetables.” The dish hasn’t changed, but the appeal has.
Using eye-catching descriptions and visual cues can entice customers to order high-margin items, thereby increasing overall sales and revenue. Similarly, incorporating seasonal items and locally sourced ingredients can create excitement and justify higher prices.
Portion Size Optimization to Reduce Food Waste
If you draw a Venn diagram with one circle representing customer satisfaction and the other cost control, the portion size would be at the overlap. Think about it – If plates are consistently coming back half-finished, that means you can trim portions, and no one is going to complain in the first place. But, again, you’d have to be very careful when it comes to a plowhorse. If it feels skimpy, it will lose popularity fast, so any adjustment has to be tested carefully and rolled out gradually.
How Digital Menus Are Changing Menu Engineering
Physical menus have always had the constraint that if you’re going to change item pricing or swap items, you’d need to reprint the entire menu.
When it comes to online menu engineering (or digital menus), restaurant managers can update prices, swap descriptions, or cut out the dog at any moment.
This also means restaurants can finally get a detailed breakdown of real-time sales trends and act on them ASAP. Modern restaurants using digital and online menu tools can A/B test descriptions, track menu layout changes, and adjust the size of portions or pricing based on changing customer preferences.
Better alignment between what’s ordered and what’s prepped can also substantially reduce food waste; some restaurants report improving inventory management through better menu alignment to the point that they cut waste by up to 50%.
What are the Common Mistakes You Should Avoid When You Engineer a Menu?
Even restaurant operators who take menu engineering seriously tend to trip over some mistakes, like:
#1: They analyze their menu once and never again, and so when food costs and customer preferences change, their menu slides out of balance.
#2: They let emotion override the data. Yes, keeping a dog on the menu because it’s a chef’s favorite or because “we’ve always had it” is understandable, but it’s not profitable in the end.
#3: They overload their menu. As already mentioned above, too many items on the menu create decision fatigue for guests and unnecessary complexity in the kitchen.
#4: They focus only on the food cost percentage, not on the contribution margin.
#5: They make every change at once, which is a really wrong strategy because adjusting price, description, and placement for ten items simultaneously makes it impossible to know what actually worked.
#6: They completely skip the staff and customer feedback.
Remember, at the end of the day, menu engineering is all about using forecasts and analysis, paired with a bit of design and a bit of psychology, to build a menu that customers enjoy and that consistently makes your restaurant more money.
KEY TAKEAWAYS
| – Menu engineering involves categorizing menu items based on their popularity (sales volume) and profitability, allowing restaurants to identify which items contribute more to profit margin and which may need to be updated or removed. – The contribution margin, calculated as the menu price minus the item’s direct cost, is a key metric in menu engineering that helps determine the profitability of menu items and guides categorization. – The menu revamp process typically includes steps such as determining food costs, analyzing sales data, and categorizing items into groups like stars, plowhorses, puzzles, and dogs to inform menu changes. – To effectively analyze a menu, restaurant owners should categorize menu items based on their popularity and profitability, often using a matrix to identify which items are stars, plowhorses, puzzles, or dogs. – Optimizing “Plowhorses” involves identifying popular but low-profit items and increasing their profitability without losing sales volume. |
Frequently Asked Questions
1. What data do you need to start menu engineering?
To begin with menu engineering, gather sales reports, recipe costs, ingredient costs, and pricing data for all food items. Such menu analysis helps measure menu item profitability, an item’s popularity, customer demand, and overall menu performance, providing valuable insights to improve a restaurant’s profitability.
2. What is the 30/30/30 rule for restaurants?
The 30/30/30 rule suggests allocating roughly 30% of revenue to food costs, 30% to labor, and 30% to overhead. While not a strict benchmark, it supports menu engineering by encouraging operators to focus on low food cost items, optimize menu offerings, increase sales, and increase profits.
3. What are the other 10% in the 30/30/30 rule?
The remaining 10% in the 30/30/30 rule represents the restaurant’s operating profit after covering food, labor, and overhead expenses. Strong menu engineering and effective menu design can help maximize this margin by encouraging customer spending, promoting high-profit items, reducing reliance on the cheapest item, and helping reduce costs.
4. What are the three components of menu engineering?
The three core components of menu engineering are menu analysis, an item’s profitability, and an item’s popularity. Together, they help restaurants create menus and refine menu offerings that improve customer satisfaction while driving long-term restaurant profitability through the principles of menu planning.